Web GUI lag on a high-port SMS modem is usually reported as a device fault and is usually caused by the management layer competing with the workload. The interface is slow because it is being asked to render a record that keeps growing, while the same device is busy sending messages.
This article covers why the interface slows as the log fills, how retention settings change performance, why polling intervals matter more than most teams expect, how to separate management traffic from the sending path, and what to record so the next investigation starts from data rather than from a description.
Why does web GUI lag appear on a high-port SMS modem as the log fills?
Because the console reads through the record to render it.
A management interface that lists messages, deliveries and events is querying a growing store, and the cost of that query rises with the number of rows it has to consider.
The effect is not linear and it is not obvious at first. A device with a few thousand recorded events renders its message view quickly; the same device with several hundred thousand takes seconds per page, and the delay is easily mistaken for a network problem because the browser shows nothing until the response arrives. The confusion is compounded when the same interface is reached over a slow link, since the two delays add together and neither is visible separately.
The diagnostic question is therefore whether the delay is in the device or in the path. Request the interface from a host on the same network as the device; if it remains slow, the device is the constraint. If it becomes fast, the path is. That one test separates the two categories before any setting is changed, and it costs a single browser session.
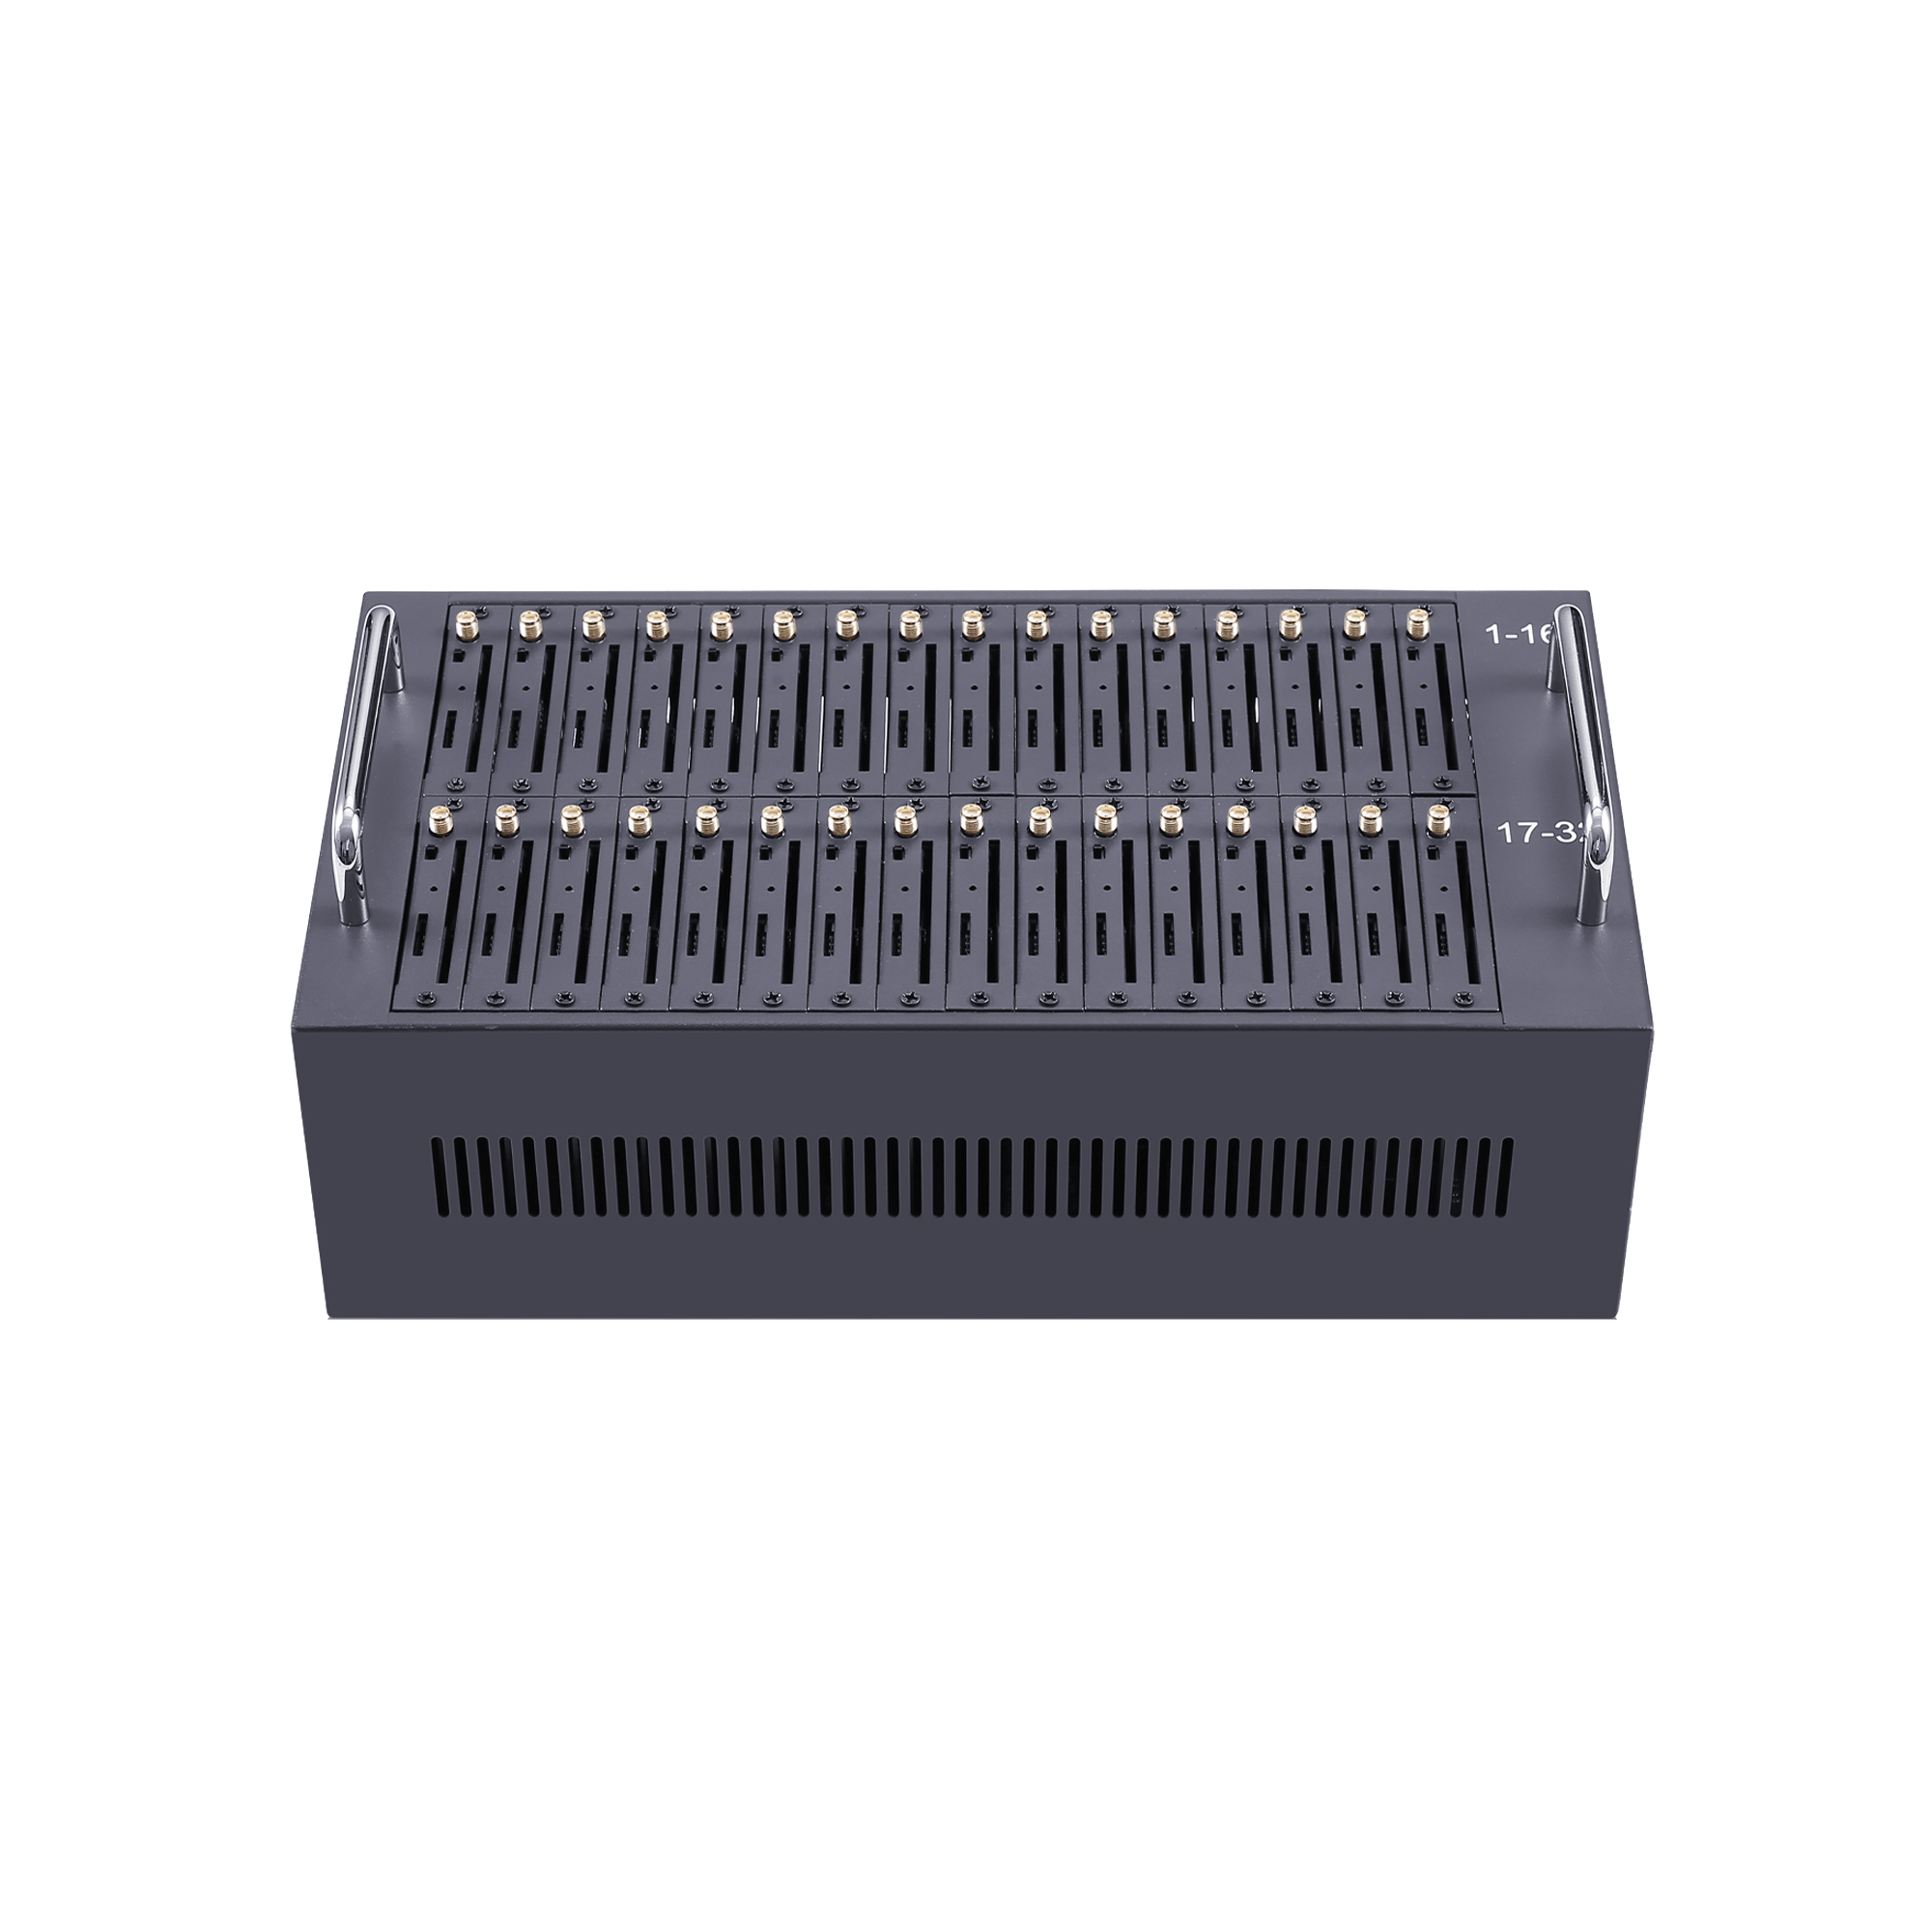
Retention settings and their effect on performance
Retention is a performance setting, not only a storage one.
A shorter retention window keeps the console responsive and removes evidence you may need, so the value has to be chosen against the length of the investigations the deployment actually performs.
Two requirements pull in opposite directions. Operational investigations need history: a delivery dispute that surfaces three weeks after the fact requires the record from three weeks ago. Interface responsiveness needs a small table. The compromise is usually to keep a short window on the device and export the full record to storage you control, which satisfies both without asking the device to do work it was not designed for.
Where a device offers separate retention settings for different record types, set them independently. Delivery outcomes and authentication events rarely have the same useful lifetime, and a single global value is either too short for one or too long for the other. Record the values chosen and the reason, because a retention setting without a stated purpose will be changed by whoever notices the disk filling. Record-keeping practice for operational logs is the subject of NIST SP 800-92.
| Record type | Typical need on device | Where the long record lives |
|---|---|---|
| Delivery outcomes | Long enough to investigate a dispute | Exported to your storage |
| Device events | Long enough to correlate with an incident | Exported or forwarded |
| Authentication events | Until reviewed | Forwarded to a log platform |
| Debug traces | Minutes, and only while enabled | Not retained |
Polling intervals and console load
A monitoring job can be the load it is measuring.
Every poll is a query, and polling every slot every second issues thousands of queries an hour against the same store the interface is trying to render.
The symptom is characteristic: the interface becomes slow after a monitoring integration was added and not after traffic increased. The correlation is easy to miss because the two events are usually weeks apart, and the monitoring job is rarely suspected because it was introduced as an improvement. Recording the date each integration was added is what makes the correlation visible.
Three changes usually recover most of the performance. Increase the polling interval and accept the reduced resolution. Poll fewer entities by reading device-level summaries where per-slot figures are not needed continuously. And stagger the polling so that all slots are not queried in the same second, which turns a spike into a flat load. The command interface used for this kind of interrogation is standardised in ETSI TS 127 005, with the 3GPP equivalent at 3GPP TS 27.005, which is the reference for what a polling loop can request.
One measurement makes the whole investigation shorter: request the same interface from a host inside the device network and from a host outside it, and compare. The difference between the two figures is the path, and what remains is the device. Without that comparison, every slow console produces the same debate about whether the network is at fault.
Treating the interface as cosmetic is a mistake. An operator who cannot read the device reliably will work around it by changing settings without evidence, and that is how a performance complaint becomes a configuration problem and then an outage.
How do you separate management traffic from workload?
Give the console its own path where the device allows it.
Separating management from workload keeps a dashboard refresh from delaying a submission and keeps a busy sending path from making the console unusable.
Where the device has more than one network interface, using one for management and another for message traffic is the cleanest arrangement, because the two paths contend for nothing at the network layer. Where only one interface exists, the separation has to happen at the traffic level: restrict management access to a defined set of source addresses, and keep the monitoring job on a schedule that does not coincide with peak sending.
Configuration changes belong in the quiet period as well. A bulk edit applied during a campaign competes with the sending path, and the change itself may appear to fail because the interface is slow rather than because the change was rejected. Where a change has to be made during traffic, apply it to one unit or one slot group first and confirm the result before continuing.
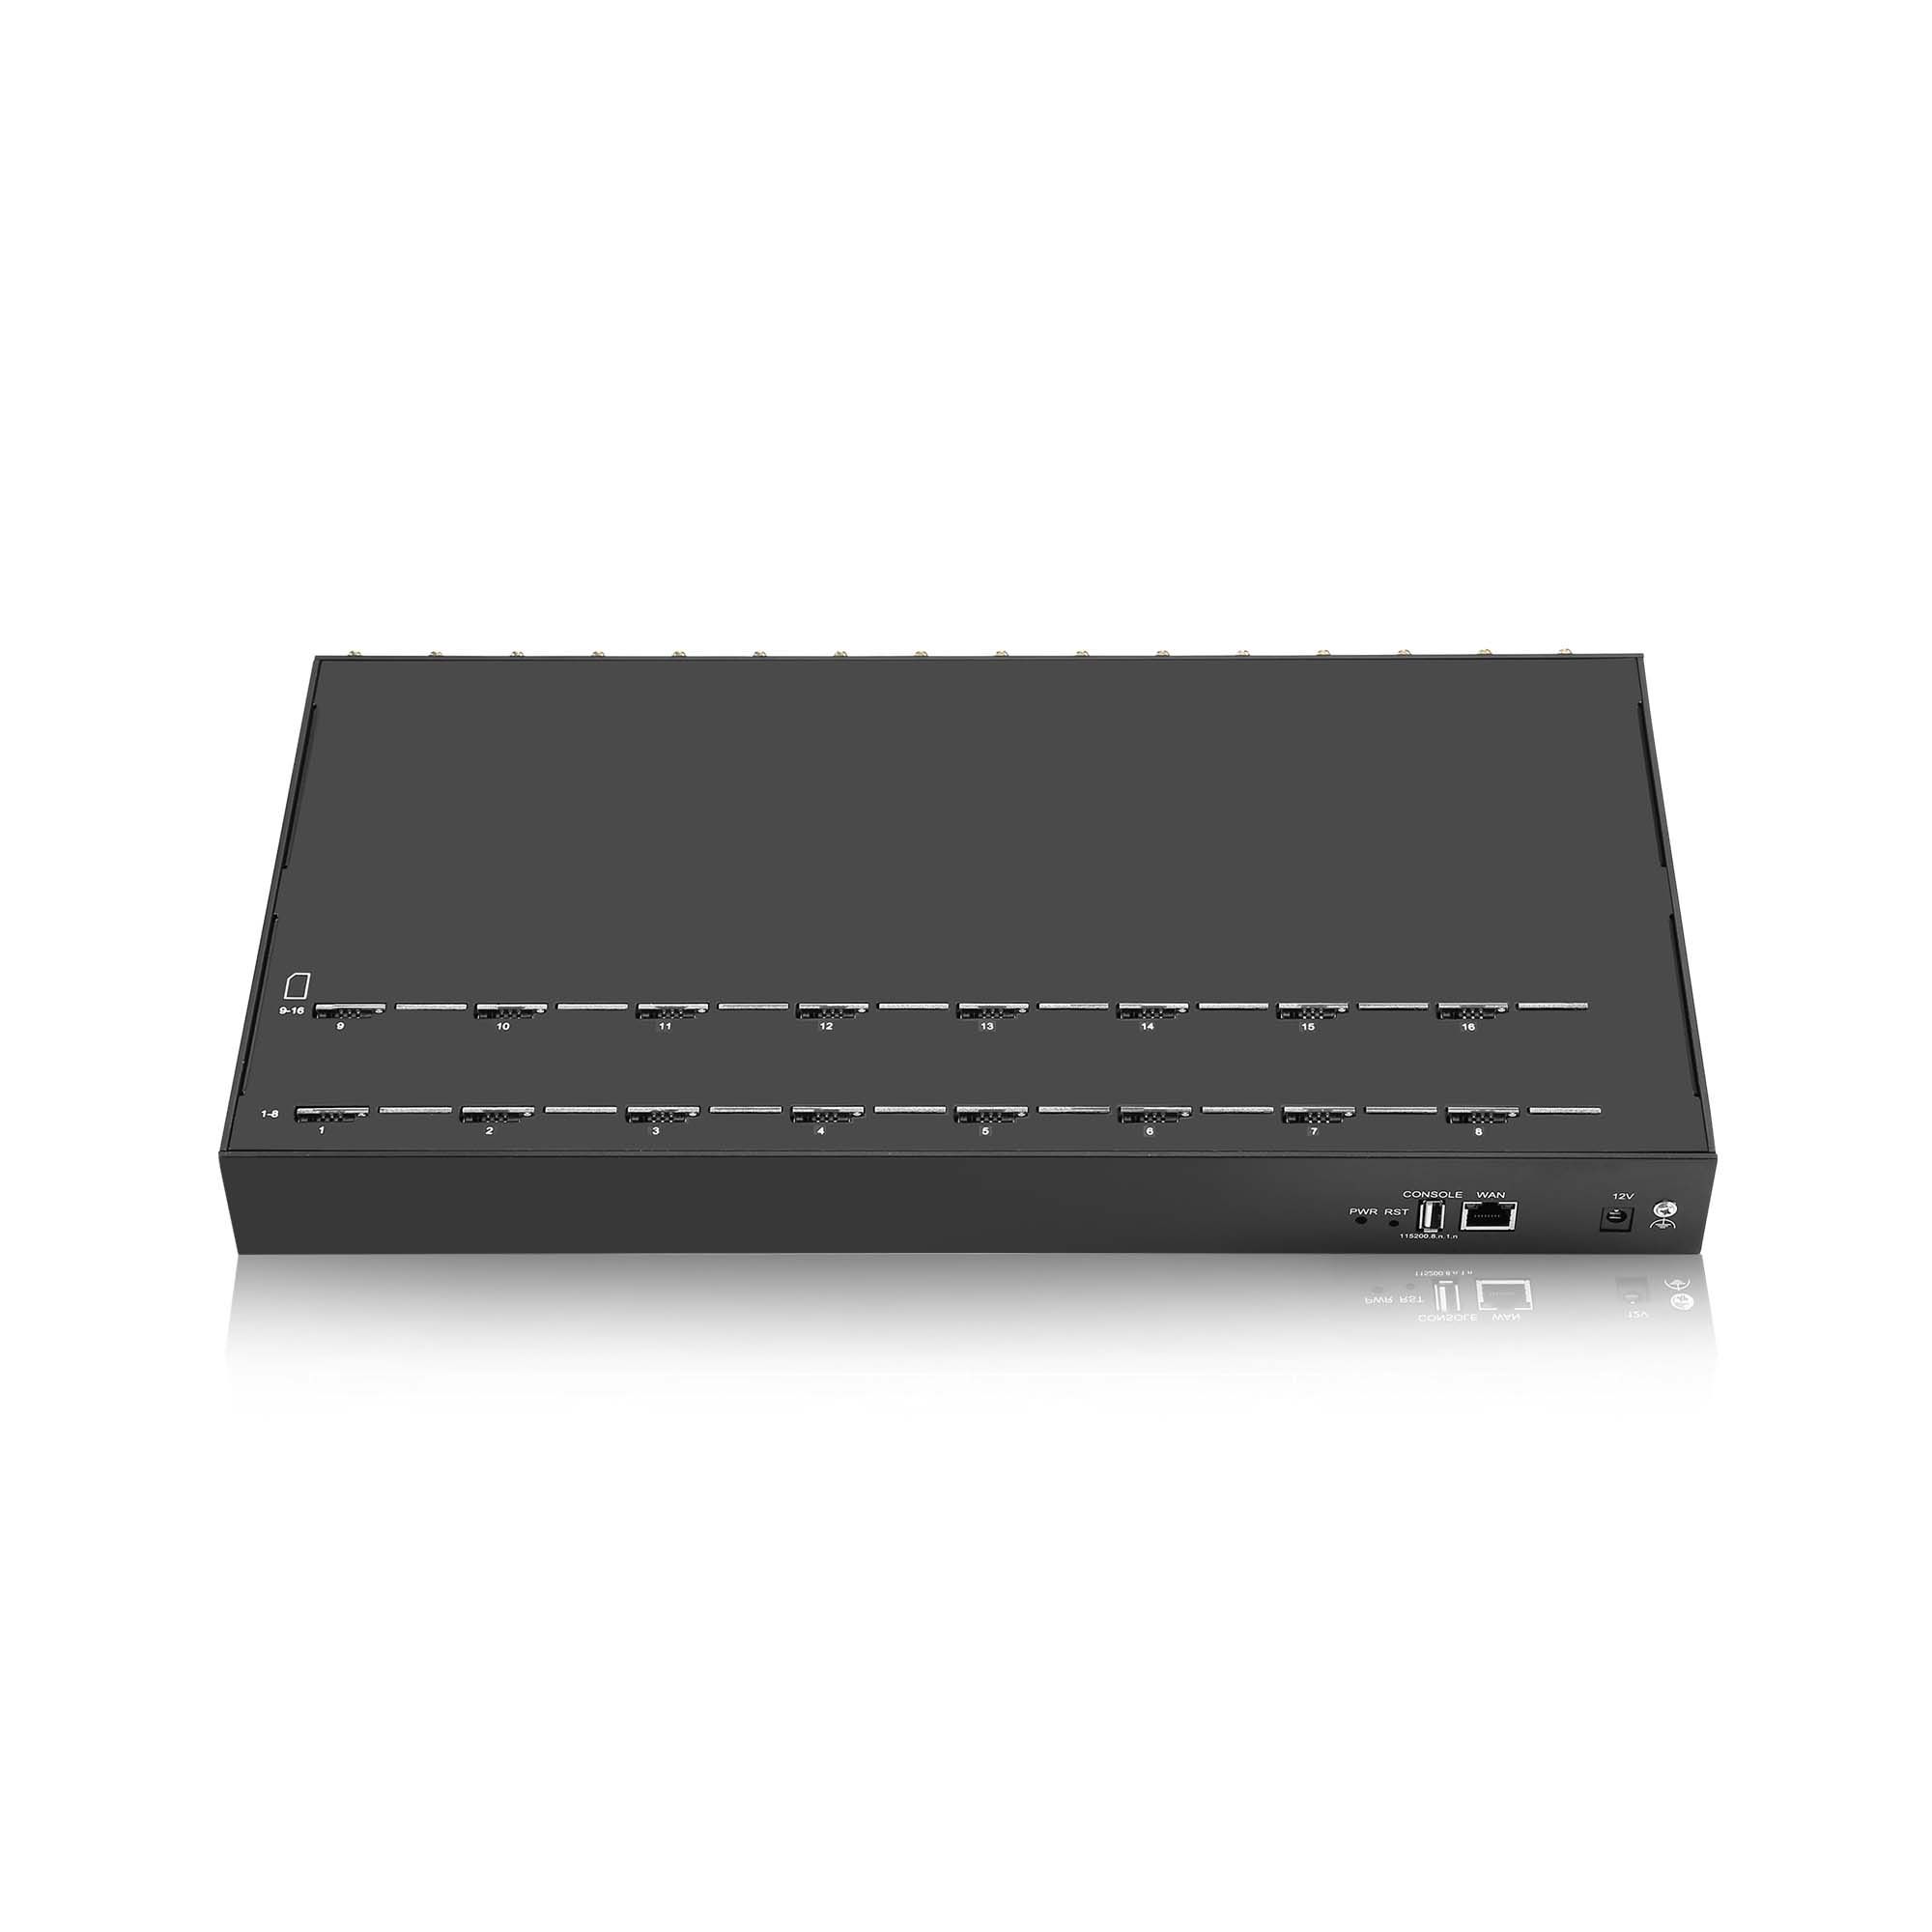
Exporting to your own storage
Export on a schedule rather than on demand.
An export triggered by a person arrives after the incident, while a scheduled export means the record exists before anyone needs it.
The design that works is unremarkable: a job that reads the device record for a window and writes it to storage you control, with the window chosen to overlap the previous run so that a missed run does not create a gap. Running on overlap and deduplicating on the record identifier is more robust than assuming every run succeeds.
Keep the export separate from the device in every sense. Storage on the device is storage that disappears with the device, and an export that lives on the same host as the monitoring job disappears with the host. Where the deployment spans many sites, the export destination should be common to all of them, so that an investigation does not have to be repeated site by site. The port and service conventions used to reach an export destination are catalogued by the Internet Assigned Numbers Authority in its service name and port registry.
How do you verify performance at the configured limit?
Test with the record full, not empty.
A console that responds in 200 milliseconds on a clean device tells you nothing about its behaviour once the retention window has filled and the polling job is running.
Two tests are worth running. The first is a time-to-render measurement taken with the record at its retention limit and traffic running, which gives the realistic figure for the interface. The second is the same measurement with the monitoring job paused, which isolates its contribution. The difference between the two is the cost of monitoring, and it is usually larger than anyone expects.
Record both figures with the configuration that produced them. Where the deployment has several sites with different populations, measure at the largest site rather than at the most convenient one, since the console is a shared resource and its behaviour degrades with the number of entities it has to display. The delivery events that the console renders follow the status reporting model described in ETSI TS 123 040, which is a useful reference for how many records a given traffic volume will produce.
What to record for the next investigation
Record the configuration and the measurement together: retention values per record type, polling interval and schedule, number of entities polled, interface path, and the render times measured with and without polling. Add the approximate record count at the time of measurement, because the figure is meaningless without the size of the store it was taken against.
The device states that a slow console sometimes makes it hard to observe are defined in 3GPP TS 24.301, and knowing them is useful when an interface that is merely slow is mistaken for a device that is not registering. A record that separates the two saves an hour every time it happens.
Measure the console with the record full and polling on. Send your retention settings, polling schedule and render times to service@telarvo.com, or review the published configurations on the SMS modem range and the SMS modem solution page. Telarvo publishes the SK-SMS gateway range, the TYH modem pools and the TGW SMS machine on its product pages, and the configurations referenced above come from those listings.
FAQ
Why is the web interface slow only at certain times of day?
Because the interface competes with the workload, and the workload is uneven. Peak sending periods consume more of the device, so the console slows at the same hours. If the pattern follows traffic rather than the clock, the cause is contention rather than a fault, and separating management from the sending path is the remedy. Where the pattern follows a schedule such as a nightly export, the cause is that job rather than the sending load.
Does clearing the log improve the interface?
It does, and it also deletes the record you will want during the next investigation. Export the record to your own storage first, then shorten the retention window. Clearing without exporting converts a performance problem into an evidence problem, and the second is harder to fix after the fact. Confirm that the export is complete by checking the record count, because a partial export is worse than none.
How often should the console be polled?
As infrequently as the operational need allows, and staggered so that all entities are not queried at once. Three samples per hour at a fixed offset usually gives enough resolution for an estate, whereas polling every entity every second adds measurable load and is rarely justified by what it detects. Staggering matters more than the interval, because simultaneous polling produces the bursts that are visible to users.
Should the management interface be reachable over the internet?
Only where no alternative exists, and with restrictive source addressing and strong authentication when it is. Exposure is a security decision rather than a performance one, but the two interact: an interface that is slow enough to time out encourages people to disable protections to make it usable. Treat any temporary relaxation as a dated exception with a review, not as a setting.