Monitoring SIM signal strength through an API is easy to start and hard to make useful, because most collections gather the wrong granularity and then produce alerts that everybody ignores. The value comes from reading signal per SIM and correlating it with delivery outcomes.
This article sets out which figures are worth collecting, why per-SIM readings matter more than device-level ones, how thresholds differ between module generations, how to build an alert that produces action, what signal cannot tell you, and a minimal collection design that stays useful as an estate grows.
Which signal figures are worth collecting when you monitor SIM signal strength via an API?
Level, quality and the time the reading was taken.
A single strength number is not enough to act on; the useful set is signal level, a quality measure where the module provides one, and a timestamp that makes the series comparable.
Modules commonly report received signal level and a quality indicator, and the two do not always move together: a strong signal containing interference can produce poor quality, while a weak signal on a clean channel can deliver reliably. Collecting only the level makes the two cases indistinguishable, and the resulting alert sends an engineer to check an antenna when the problem is interference. The radio characteristics that the readings describe, including the conditions under which terminal equipment is specified, are set out in 3GPP TS 45.005.
The timestamp matters more than it appears. Signal readings are only interpretable as a series, and a series with inconsistent sampling intervals cannot be compared week to week. Store the reading time explicitly rather than relying on the insertion time of a database row, because the two diverge as soon as a collector queues or retries.

Why read signal per SIM rather than per device?
Because a device average hides the slot that is failing.
A rack of thirty modules reports a healthy mean while one slot sits at the edge of coverage and produces a disproportionate share of the failures.
The mechanism is straightforward: the failing slot retries more, so it consumes more airtime for the same delivered volume, and its failures appear as a delivery problem rather than as a signal problem. A device-level metric cannot show this because the other twenty-nine modules keep the average acceptable. Per-SIM collection makes the outlier visible immediately, and the outlier is the only row anyone needs to act on.
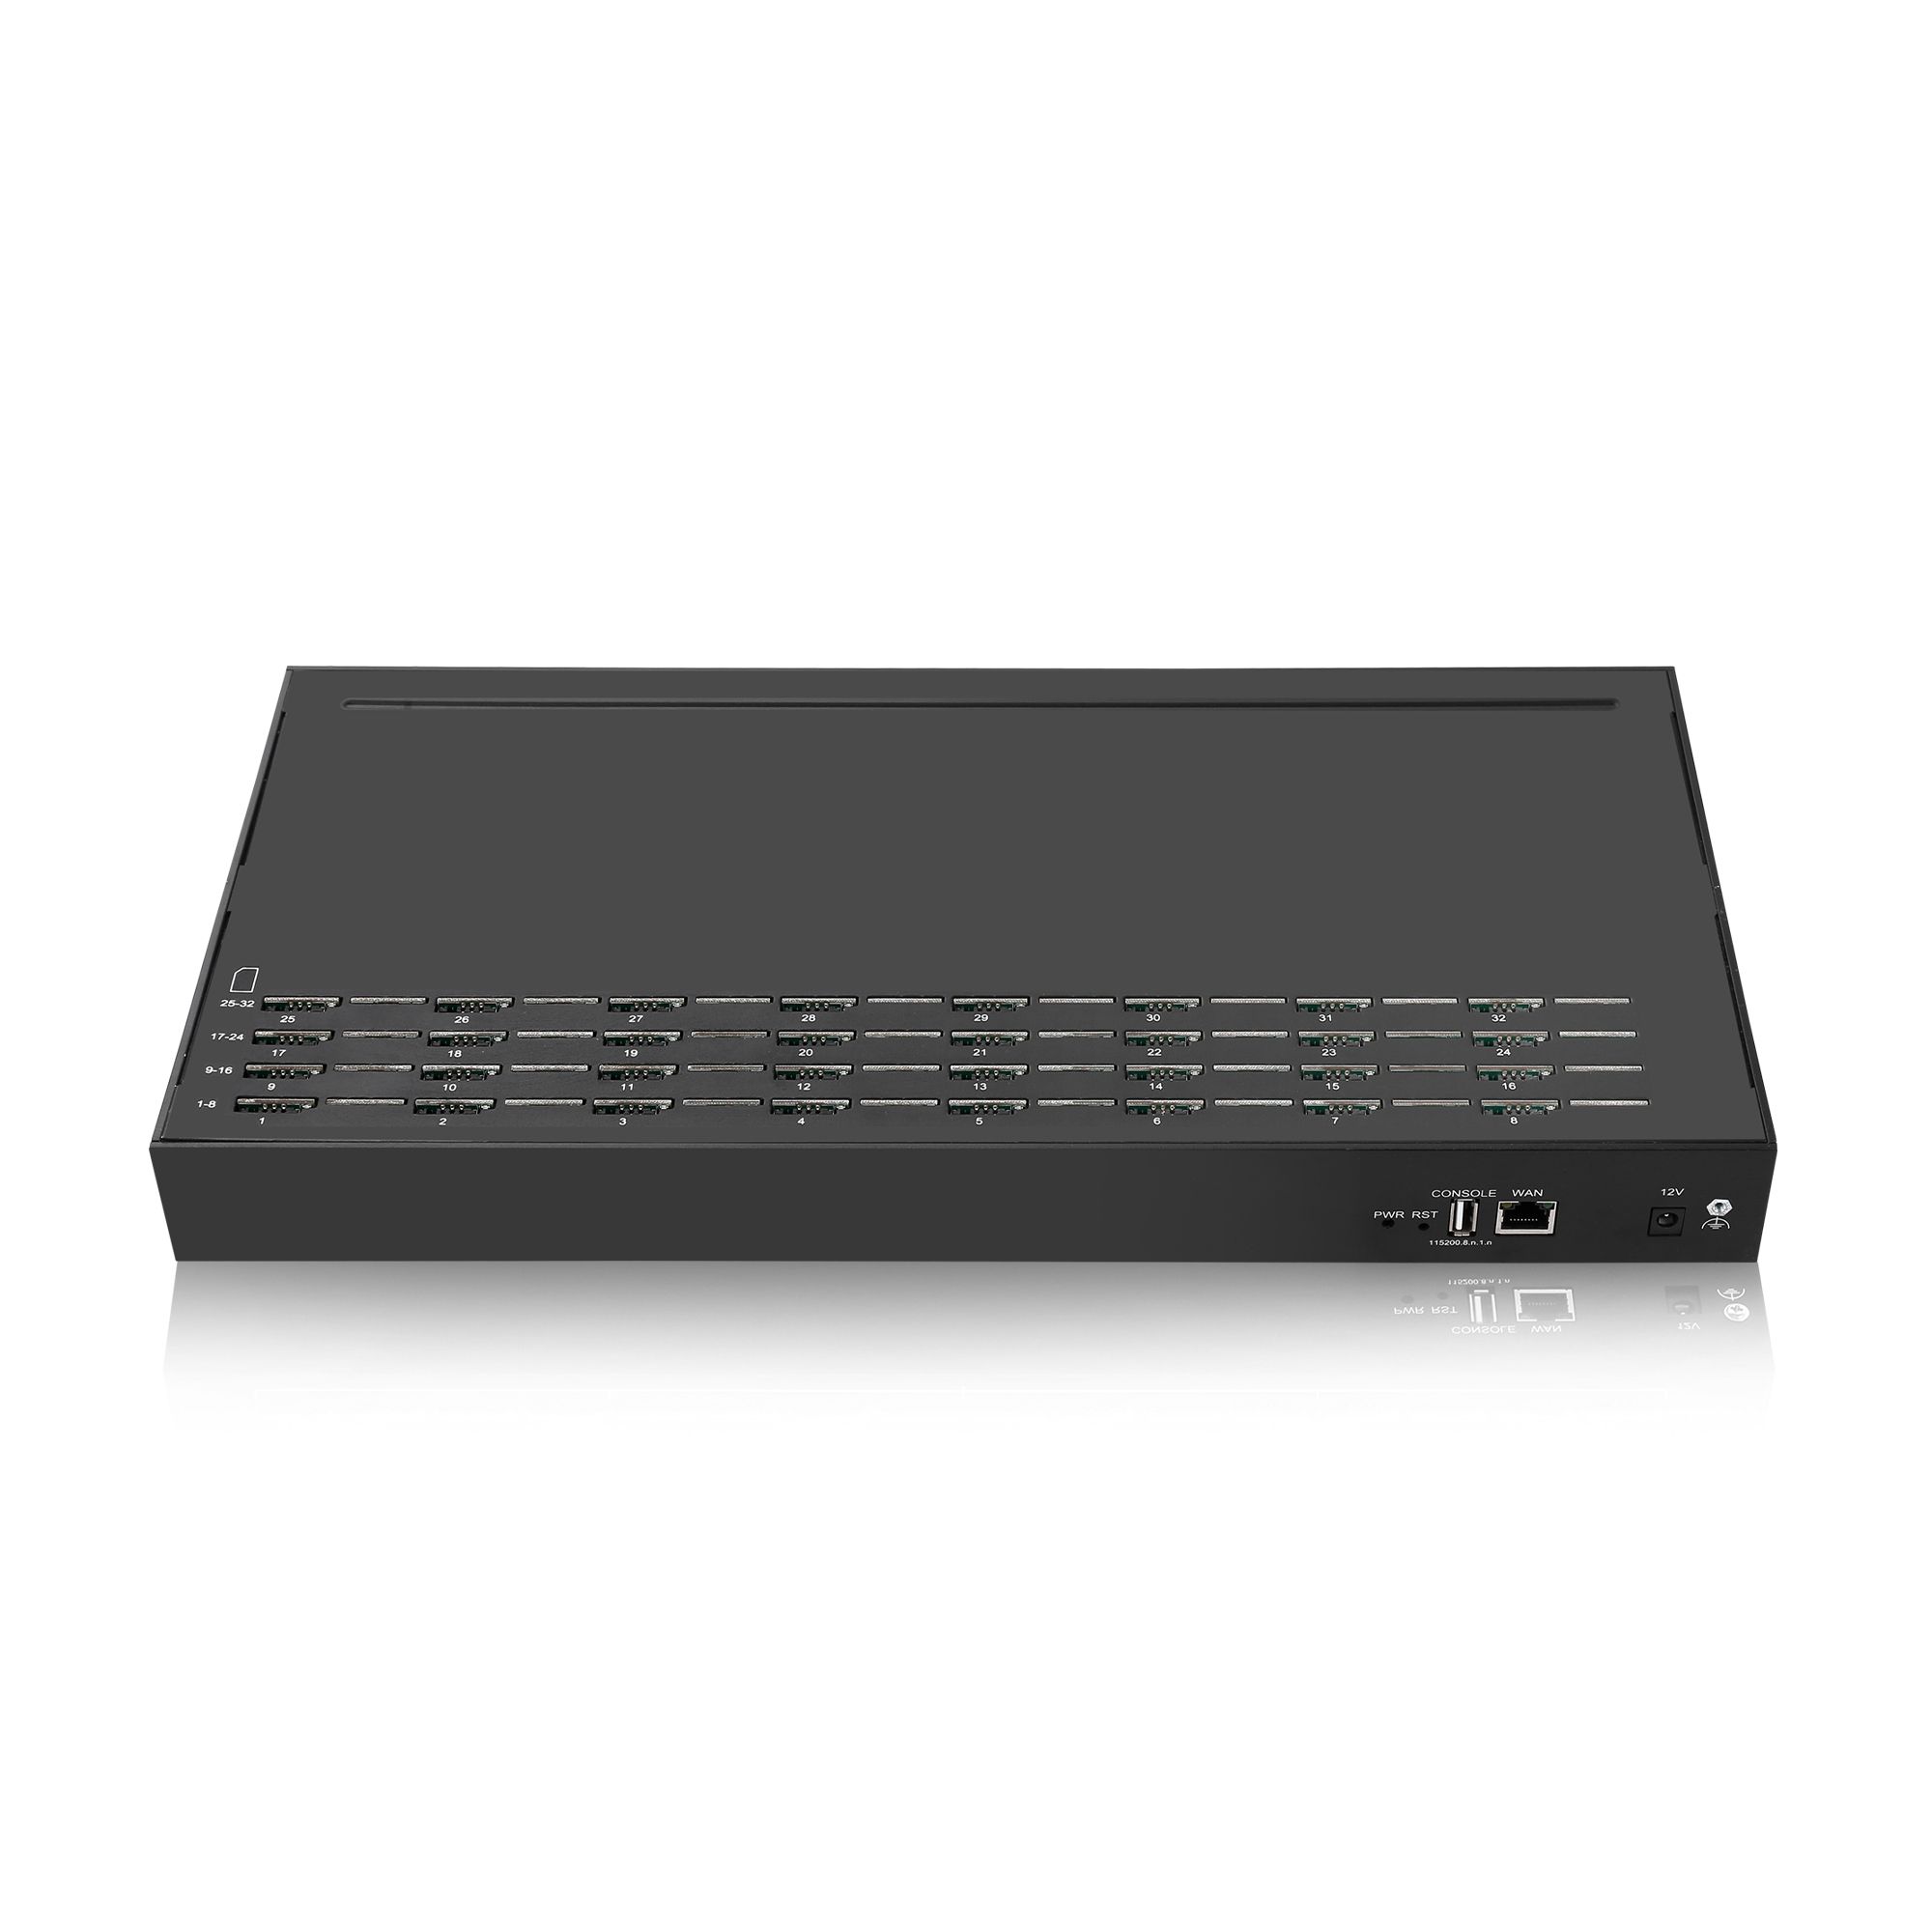
Per-slot collection also makes physical work traceable. When a module is moved, an antenna re-routed or a card swapped, the effect appears in the series for that slot, which turns maintenance into a measurable change rather than a hopeful one. Where the deployment uses a centralised SIM bank, the slot that matters for the radio reading is the module rather than the card position, and the two identifiers should be stored together so a reading can be traced back to a physical device.
| Granularity | What it shows | What it hides |
|---|---|---|
| Device average | General condition | A single poor slot in a large rack |
| Per SIM or per module | The outlier and its trend | Nothing that matters operationally |
| Per reading with timestamp | Comparability across weeks | Nothing |
| Level only | Coverage strength | Interference and quality problems |
Thresholds that differ by module generation
The same number means different things on different radios.
Signal scales are not comparable across module generations and families, so a threshold copied from one deployment can be meaningless in another.
Two practical consequences follow. The first is that thresholds should be derived per model rather than adopted from a template, which means the first task in a new deployment is to record what a working unit reports at that site. The second is that thresholds should be expressed as a deviation from that baseline rather than as an absolute figure, because the baseline already contains the coverage conditions of the location.
Where a deployment has several module types, keep a separate threshold set per type and label the series accordingly. Mixing them produces a chart that looks like performance varying over time when it is in fact recording a change of hardware, and that misreading has led more than one team to replace correctly functioning equipment. The command interface used to read the values, and the units they are reported in, are described in the equipment control specifications, including ETSI TS 127 005 and the 3GPP equivalent at 3GPP TS 27.005.
One decision makes the collection maintainable: store the raw readings and compute the aggregates downstream rather than pre-aggregating at the device. Raw readings can be re-analysed when a threshold turns out to be wrong, while a pre-aggregated figure has already discarded the detail that would have explained it. The cost is storage, which is cheaper than the alternative of re-instrumenting an estate to answer a question that was foreseeable.
Whichever design is chosen, keep the collection independent of the sending path. A monitoring job that competes with message traffic changes the thing it is measuring, and a signal series taken under a polling load is not comparable with one taken without it.
How do you turn signal data into an alert people act on?
Alert on outcomes, not on readings.
A reading that crosses a threshold is information; an alert should fire when the reading predicts a delivery problem, which means combining the two.
The rule that survives contact with operations is a conjunction: a slot whose signal has fallen below its own baseline by a defined margin, and whose delivery ratio has fallen with it. Either condition alone produces noise; both together produce a task. This is why the combination is worth building even though it requires two data sources, because the alternative is an alert stream that gets muted within a month.
Alert frequency is the second half of the design. A slot that fluctuates across a threshold every few minutes should produce one alert, not hundreds, so thresholds need hysteresis and a minimum repeat interval. Where the platform supports it, alert on the duration outside the band rather than on the crossing, since a momentary dip that recovers is not worth a notification while a sustained one is.
Correlating signal with delivery outcomes
The correlation is the useful product, not the reading.
Storing signal and delivery outcome against the same slot and timestamp turns the collection into a diagnostic tool rather than a dashboard.
The analysis that pays is simple: for each slot, plot the delivery ratio against the signal band and look for the point at which the ratio begins to fall. That point is the operational threshold for that module type at that site, and it is derived from your own data rather than from a general recommendation. It will differ between sites, because coverage conditions differ, and it will differ between module types, for the reasons already described.
Retry counts belong in the same analysis, because a slot at the edge of coverage usually shows rising retries before its delivery ratio falls. That leading indicator is the earliest warning available, and it is visible without any additional instrumentation once the retry counter is being collected. Operational records of this kind, including how long to retain them, are the subject of NIST SP 800-92.
What signal cannot tell you
It cannot tell you whether the subscription is entitled to send.
Strong signal is compatible with a suspended subscription, an exhausted account and a refused registration, and none of those are radio conditions.
This is the limitation that produces the most wasted effort. A monitoring design built only on signal will report every slot as healthy during an account problem, because the radio link genuinely is healthy. The registration states that distinguish the situations are defined in 3GPP TS 24.301, and collecting registration state alongside signal removes most of that ambiguity at no additional cost.
Signal also cannot predict a destination-side failure. A message can be delivered from a slot with excellent signal to a network that is not accepting traffic, and the failure will look like a delivery problem while the radio reading remains perfect. This is why the outcome series has to be part of the collection rather than an optional extra.
A minimal collection design
The design below is the smallest version that produces an alert somebody acts on. It collects a few figures per card at a fixed interval, stores them with their timestamp, and joins them to delivery outcomes, which is the part that turns a reading into a decision. Anything beyond this is optional until the basic series has been shown to change behaviour.
- Read signal level, quality where available, and registration state per module.
- Record a reading timestamp taken at the module rather than at the collector.
- Store the module identifier and the card identifier together.
- Keep a per-model threshold set, derived from observed behaviour at each site.
- Join delivery ratio and retry count to the same slot and time window.
- Alert on the conjunction of signal deviation and outcome decline, with hysteresis.
The design is deliberately small. Signal monitoring produces value when it is joined to outcomes and very little value on its own, so the effort belongs in the join rather than in the sampling rate. Where the collection reaches a remote site over a network service, the port and service conventions used are catalogued by the Internet Assigned Numbers Authority in its service name and port registry.
Join signal to outcomes, or the numbers will not be read. Send your collection design, module mix and alert thresholds to service@telarvo.com, or review the published configurations on the SK-SMS Gateway range and the SMS gateway solution page. Telarvo publishes the SIMBANK and SIMPOOL ranges on its product pages, and the configurations referenced above come from those listings.
FAQ
How do I check signal strength from an API rather than a dashboard?
Read the values that the device exposes through its management or command interface and store them per module with a timestamp. The value of doing it through an interface rather than a screen is that the readings can be joined to delivery outcomes automatically, which is what produces an alert worth acting on. Keep the raw value as well as the derived one, because scales differ between module generations.
How often should signal be sampled?
Often enough to see a trend and rarely enough not to add load. Sampling every few minutes per module is usually sufficient for detection, and a fixed interval keeps the series comparable. Sampling every second produces volume without improving the decision, and it competes with the sending path. Where the collection runs on the same host as the application, the interval is also a capacity decision.
Why does a slot with good signal still fail to deliver?
Because signal describes the radio link and not entitlement to send. A subscription can be suspended or out of credit with an excellent link, and a destination network can refuse traffic regardless of the local reading. Collecting registration state and delivery outcome alongside signal is what removes the ambiguity. A signal reading on its own is a description of conditions rather than of service.
Can we use one threshold for the whole estate?
Not reliably. Signal scales are not comparable across module generations, and the same reading means different things at sites with different coverage conditions. Derive thresholds per model and per site from observed behaviour, and express them as a deviation from the site baseline rather than as an absolute number. Review the threshold whenever the site changes, because the baseline moves with it.
{
“@context”: “https://schema.org”,
“@type”: “FAQPage”,
“mainEntity”: [
{
“@type”: “Question”,
“name”: “How do I check signal strength from an API rather than a dashboard?”,
“acceptedAnswer”: {
“@type”: “Answer”,
“text”: “Read the values that the device exposes through its management or command interface and store them per module with a timestamp. The value of doing it through an interface rather than a screen is that the readings can be joined to delivery outcomes automatically, which is what produces an alert worth acting on. Keep the raw value as well as the derived one, because scales differ between module generations.”
}
},
{
“@type”: “Question”,
“name”: “How often should signal be sampled?”,
“acceptedAnswer”: {
“@type”: “Answer”,
“text”: “Often enough to see a trend and rarely enough not to add load. Sampling every few minutes per module is usually sufficient for detection, and a fixed interval keeps the series comparable. Sampling every second produces volume without improving the decision, and it competes with the sending path. Where the collection runs on the same host as the application, the interval is also a capacity decision.”
}
},
{
“@type”: “Question”,
“name”: “Why does a slot with good signal still fail to deliver?”,
“acceptedAnswer”: {
“@type”: “Answer”,
“text”: “Because signal describes the radio link and not entitlement to send. A subscription can be suspended or out of credit with an excellent link, and a destination network can refuse traffic regardless of the local reading. Collecting registration state and delivery outcome alongside signal is what removes the ambiguity. A signal reading on its own is a description of conditions rather than of service.”
}
},
{
“@type”: “Question”,
“name”: “Can we use one threshold for the whole estate?”,
“acceptedAnswer”: {
“@type”: “Answer”,
“text”: “Not reliably. Signal scales are not comparable across module generations, and the same reading means different things at sites with different coverage conditions. Derive thresholds per model and per site from observed behaviour, and express them as a deviation from the site baseline rather than as an absolute number. Review the threshold whenever the site changes, because the baseline moves with it.”
}
}
]
}