High latency in a VoIP and SMS gateway is almost always reported as a single number, and that number almost always hides three different delays measured together. Splitting them is what turns a frustrating complaint into a fixable one.
Call quality and message delivery degrade for different reasons, and a deployment that carries both on one hardware family inherits both sets of causes. This article sets out how to separate queue delay, transmit delay and network delay, what the standards actually recommend as an acceptable figure, and the order in which to change settings so that each test tells you something.
What counts as high latency in a VoIP and SMS gateway?
Under 150 ms one-way is the usual planning target.
The ITU-T recommendation G.114 treats one-way delay up to 150 ms as acceptable for most applications, with the figure rising to about 400 ms where the application can tolerate it.
This is the question that the top-ranking pages answer least well, because most latency content conflates a network measurement with a user-perceived experience. ITU-T G.114 is the reference for end-to-end transmission delay in speech applications, and it is worth reading before quoting a number in a service commitment, because the recommendation describes categories of tolerance rather than a single threshold that applies everywhere.
Two qualifications matter for gateway deployments. The first is that the recommendation describes one-way delay, while most teams measure round-trip time and then compare it against a one-way threshold. The second is that the budget is end to end: it includes encoding, transmission, network transit and decoding, so a gateway that contributes 20 ms to a chain that already spends 140 ms elsewhere has not solved the problem.
For messaging the relevant threshold is different again. A short message is not a conversation, and a delivery that takes two seconds is rarely a complaint while a voice path that adds 200 ms is immediately audible. Measuring both with one target is what makes a shared understanding with the business difficult to reach.
How do you split latency into queue, transmit and network components?
Measure at three points and the delay separates itself.
Compare the timestamp when the application submitted the work, the timestamp when the gateway began transmitting, and the timestamp when the far end acknowledged it, and the three delays become visible.
Queue delay is the time a job waits inside your own platform before the gateway touches it. It is the delay that grows silently as load rises, and it is the only one of the three that is entirely inside your control. Transmit delay is the time the gateway spends turning the request into radio or IP traffic, including any setup work per message. Network delay is what happens after the packet leaves, and it is the component most often blamed and least often responsible.
The measurement that separates them does not need instrumentation on the radio path. Emit a monotonic timestamp when the application hands the message to the platform, another when the platform reports that it began sending, and a third when the receipt arrives. Subtracting the first from the second gives queue delay; the second from the third gives transmit plus network; and a separate echo test measures network transit on its own.
| Component | Where it appears | What changes it |
|---|---|---|
| Queue delay | Between submission and first send attempt | Concurrency, retry storms, batch scheduling |
| Transmit delay | Between first attempt and hand-off | Per-message setup work, session handling, codec choice |
| Network delay | Between hand-off and acknowledgement | Path, congestion, transcoding, carrier acceptance |
The distribution matters more than the average. A system with a 40 ms median and a 900 ms ninety-fifth percentile will be described as fast by its average and as unreliable by its users, and the operations team will be unable to reproduce the complaint. Record the distribution, not the mean.
What does the Real-time Transport Protocol tell you about the delay?
It gives you the timing data the endpoints already exchange.
RTP carries sequence numbers and timestamps, and its companion control protocol reports packet loss, jitter and round-trip estimates, so voice degradation can be measured from the media stream itself rather than inferred.
That distinction is why voice and messaging latency need different instruments. RFC 3550 defines the transport protocol and its control messages, and the profile in RFC 3551 sets out how payload types and clock rates are associated with codecs. If the receiver reports show stable interarrival times while users still report delay, the problem is not the network; it is the path taken before the stream was created.
Signalling delay is separate again. Setting up a call involves a request and a response that follow the flows defined in RFC 3261, and a gateway that is slow to answer a signalling request produces a delay that no media measurement will show. Where in-band tones are used, their transport is specified in RFC 4733, and a mismatch in that handling shows up as a perceptible wait before the first tone or digit is recognised.
Reading these three sources together gives a coherent picture: the signalling path for setup, the media path for conversation, and the log timestamps for the delay your own software adds before either begins.
How much does codec and transcoding cost add?
Transcoding adds delay every time the encoding changes.
Each conversion decodes and re-encodes the stream, and the processing time plus the buffering around it is added to the end-to-end total on both directions of the call.
The cheapest path is the one where the codec chosen by the far end is carried through without conversion. Every intermediate step that has to re-encode introduces both processing delay and a small buffer to smooth jitter, and the buffers accumulate along the chain. This is why two deployments with identical hardware and identical network paths can produce noticeably different call quality: one carries a single codec end to end and the other converts at the edge.
The second cost is negotiation. Even where no conversion is required, each call spends time agreeing on what will be used, and a configuration that offers a long list of alternatives lengthens that agreement. Narrowing the offered set to what the network and the endpoints actually share shortens setup without affecting quality.
Why does command round-trip time grow at high port counts?
Per-port work is serialised somewhere in the path.
As port count rises, the time spent issuing and confirming commands grows faster than the traffic does, because management operations compete with message handling for the same resources.
The symptom is characteristic. Throughput per port falls while the aggregate stays flat, and the delay appears in bursts that correlate with management activity rather than with message volume. Diagnostic reads, status polling, configuration writes and log flushes all contend with the sending path, and the contention is invisible if the platform reports only aggregate counters.
Three practical changes reduce it. Poll less often and cache what you poll. Move bulk configuration changes out of peak hours. And separate monitoring traffic from message traffic where the platform allows it, so that a dashboard refresh cannot delay a submission. None of these requires new hardware, and together they usually account for more of the observed delay than any network tuning.
The same principle explains why latency often looks worse immediately after a deployment change. A new monitoring integration that polls every port every second can add more load than the traffic it was built to observe.
Is carrier-side acceptance the usual culprit?
Often, and it is the component you cannot measure directly.
Once a message leaves the gateway, the operator decides when to accept and deliver it, so the far side of the delay is visible only as a difference between submission time and receipt time.
This is why the standard advice to “optimise the network” so often produces nothing. A gateway can be fast and the network clean while delivery still takes seconds, because the time is being spent inside the carrier’s systems. The evidence is a consistent gap between the transmit timestamp and the receipt timestamp that does not move when you change anything on your side.
Release and rejection reasons on the network side are described with standardised cause codes, and ITU-T Q.850 is the vocabulary for them. Reading those codes turns an argument about blame into a shared statement of what happened, and it is often the point at which an operator support team can act.
Where acceptance delays are structural, the mitigation is architectural rather than technical: pace submissions to the rate the route actually accepts, and stop measuring success by how fast the queue empties.
What should you change, and in what order?
Change the component you measured, starting with queueing.
Queue delay is fully under your control, so it is the first thing to fix; transmit and network delay are only worth attacking once the first component is stable.
The order matters because the components interact. Reducing queue delay increases the instantaneous rate the network sees, which can raise retransmissions and make the network component look worse. Fixing that by pacing submissions then changes the transmit pattern, which may expose per-port setup work that was previously hidden by the queue. Working from the inside outward keeps each change attributable.
- Measure the three components for one week before changing anything, and keep the raw records.
- Cap concurrent submissions so that queue delay stops growing with load.
- Reduce polling frequency for per-port status and move bulk configuration off peak.
- Narrow the codec set to what the path actually negotiates, and remove unnecessary transcoding.
- Pace submissions to the acceptance rate the route demonstrates, then re-measure.
Recording a latency baseline
A baseline is only useful if it is reproducible, and reproducibility comes from recording context alongside the number. For each measurement, record the port count in use, the concurrent submission limit, the codec set, the polling interval, the route or destination, and the time of day. Without those six fields, a later comparison tells you that something changed rather than what changed.
Store the distribution rather than the mean. A single percentile per hour, taken from the same measurement points, gives a series that can be compared across weeks and across deployments, and it survives staff changes in a way that a one-off test does not. Where the platform logs per-message status with carrier latency and retry counts, the raw records already contain most of what the baseline needs.
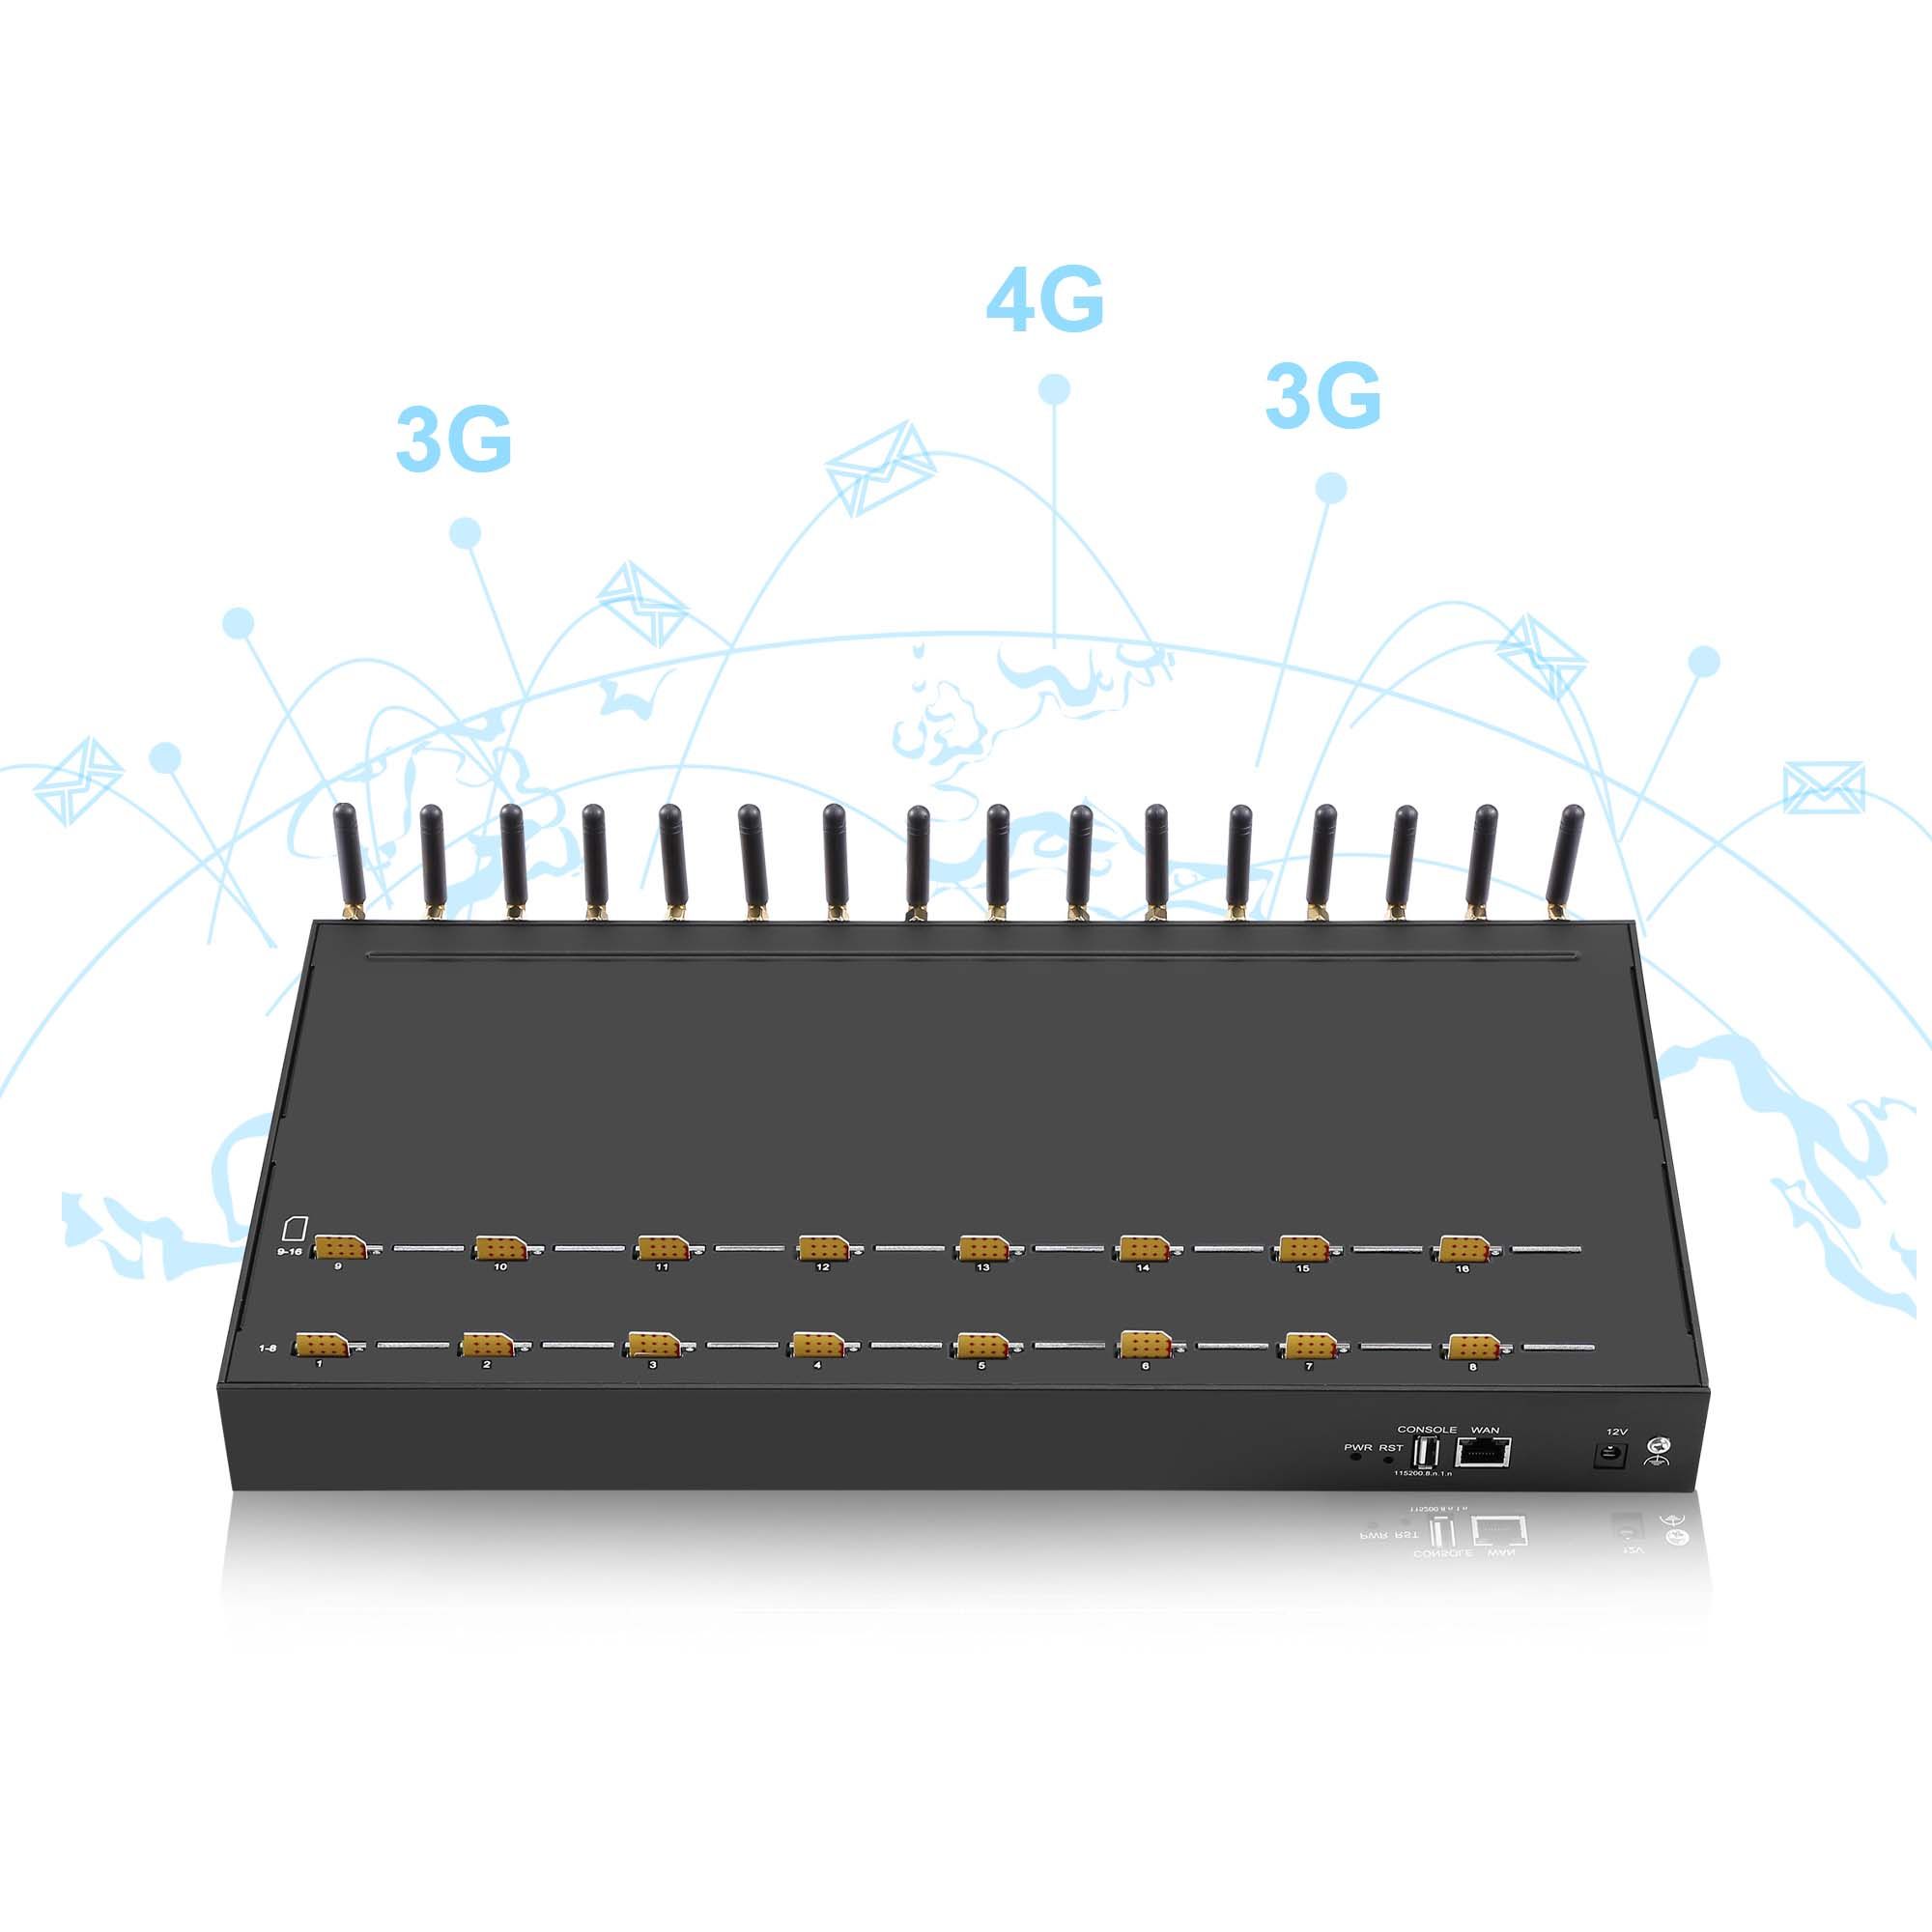
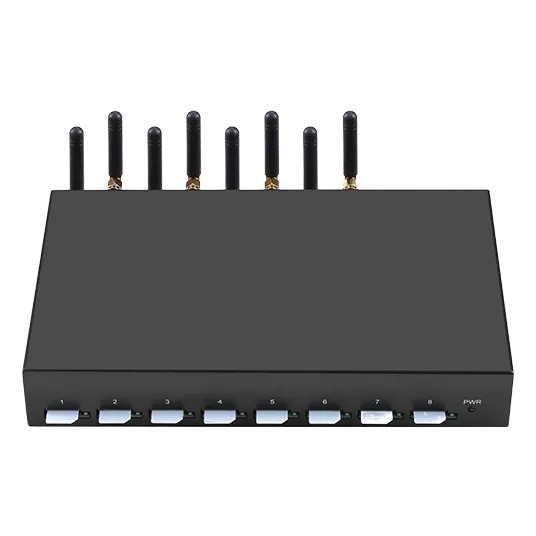
Measure before you re-specify. Send your port count, concurrent call target and current per-message timing to service@telarvo.com, or review the published configurations on the VoIP gateway range and the VoIP gateway solution page. Telarvo publishes the SK VOIP gateway range and the GoIP models on its product pages, and the configurations referenced above come from those listings.
FAQ
Is round-trip time or one-way delay the right measure?
Both, but they answer different questions. Round-trip time is what a network test reports and what your monitoring can collect continuously. One-way delay is what the user experiences and what the recommendation thresholds refer to. Record round-trip time operationally, and convert to a one-way estimate only when you are comparing against a standard. Keep the conversion rule in the baseline record so later readings are compared on the same basis.
Does adding ports always increase latency?
Not by itself, but adding ports increases the chance that management and monitoring traffic competes with sending. The delay usually arrives with the monitoring rather than with the hardware. If latency rose after a port expansion, compare the polling intervals and configuration activity before concluding that the hardware is the constraint. A polling interval shortened for a new dashboard is a common cause, and it is corrected by changing the polling rather than the hardware.
Can a carrier change explain a sudden latency increase?
Yes, and it is one of the most common causes. A route change, a new filtering rule or a capacity decision on the operator side appears as a step change in the gap between transmission and receipt. Compare the last successful baseline with the current period, and check whether any change on your side occurred in the same window. A step that begins at a specific hour and stays is almost never a component wearing out.
Should messaging and voice run on the same hardware?
They can, and the SK VOIP Gateway range is built to carry both, but the two workloads have different latency tolerance and they contend for the same cellular channel. Where either service has a hard timing commitment, measure them separately and test the worst case in which a call and a message burst coincide. If the combined worst case breaks the budget, separate devices for voice and messaging are the straightforward remedy.